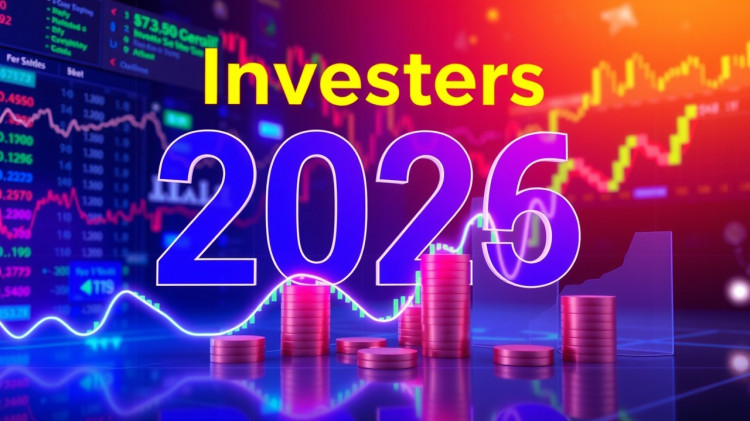
According to James Mackreides, the economy is doing well and investors are still wary
Yale Hirsch, the author of the Stock Traders Almanac, created the January Barometer in 1972. It states that the SandP index in January indicates how the year will go. With just five significant errors, the barometer claimed a 90% success rate by 2005; however, recent results have been more inconsistent.
The Covid-related downturn and the robust recovery that followed were not anticipated by a 0.2 percent loss in 2020, which resulted in a 16 percent annual gain. Despite a 1.1 percent decline in January, the market increased by 27 percent in 2021. The correlation is primarily caused by the index's upward trend, according to skeptics, who also note that the S&P has produced a positive annual return 75% of the time.
Hirsch also created an early warning system for those who didn't want to wait until the end of January, pointing out that the first five trading days of the year made up nearly as good of an indicator. He discovered the "Santa Claus rally," the index's propensity to increase during the final five trading days of the year and the first two of the New Year, for those who were even more impatient. Failing to do so might indicate a bear market, as was the case in 2000.
Hirsch credited politics for the January Barometer's success, pointing out that Congress meets during the first week, presidents are sworn in on the 20th, and the president delivers the annual budget and the State of the Union address.
A more likely explanation is that if investors are feeling upbeat in January, they are likely to stay that way and vice versa. After three consecutive years of declines, investors were understandably pessimistic in 2003, but the market recovered 26% following a weak start. The S&P was up 40 percent for the year by the end of August, but after the October crash, it ended the year up just 2 percent. This was due to euphoria and complacency brought on by a 13 percent gain in January 1987, the largest January gain ever.
Fading market seasonal patterns.
The January effect is only one aspect of the market's seasonal pattern. January marks the beginning of the reporting season for the previous calendar year, along with guidance for the upcoming year. As uncertainty decreases, share prices rise, but by the spring, this process is mostly finished, at which point prices may have gone too high. The temptation to "sell in May" (or earlier) and then buy back in the fall, when the next year is approaching, is strong because next year is still a long way off.
If markets continue to rise after selling off in the spring, as they did in 1987, there could be a severe decline or crash in the fall. On the other hand, if the year has been bad, investors might begin to anticipate better times. October is a month for both about-turns and crashes. However, as it seems to have, the seasonal pattern of markets, including the January effect, should be lessened by the greater emphasis on quarterly rather than annual results.
While recessions damage earnings due to disappointing turnover, write-offs, and rationalization costs, rising markets are based on rising corporate earnings. Although there are few indications, a recession in 2026 would be detrimental to markets. Consumers have not overspent, and neither interest rates nor leverage are high. Inflation brought on by commodity prices is not a threat.
After 2%2.5% growth this year, Ed Yardeni of Yardeni Research projects that the US economy will expand by 3%3.5% in 2026. He projects a 15% increase in earnings in 2026 and a 13% increase in 2027. The S&P 500 trades on 22 times 2026 and 19.5 times 2027 earnings based on this. This is difficult, and many analysts, particularly in the media, predict that the market will decline, with the AI-related stocks leading the way. The rest of the world typically catches a cold if the US sneezes, even though other markets are less vulnerable and more moderately valued.
An increase in bond yields is the most likely reason for the market's valuation to decline. In the hope that lowering short-term interest rates will lower bond yields and, consequently, the cost of government borrowing, central banks, including those in the US and the UK, are under political pressure to do so. This is not always the case, as the past year has demonstrated. There is a mountain of additional government debt that will require financing, and investors are not persuaded that lower rates are sustainable.
The multiple of earnings at which shares trade would likely be lowered by higher bond yields, but if earnings continue to rise, markets are more likely to trade sideways or slightly lower than to see a significant, prolonged decline. Markets are born on pessimism, develop on skepticism, mature on optimism, and die on euphoria, according to Sir John Templeton.
Euphoria is a long way off, according to sentiment indices in the US and fund flows in the UK. "Be fearful when others are greedy and greedy when others are fearful," as Warren Buffett once said. Based on that, it is undoubtedly a time to be avaricious in the UK and possibly the US.
Lastly, another well-known guideline is to buy when markets are down 10% and sell when they are up 30% annually. The UK has increased by 18% over the past 12 months, while the S&P 500 has only increased by 12%. On the anniversary of the 2025 sell-off in early April, there will be a moment of danger, but it will pass because it was quickly recovered. With the price of gold rising by more than 60% a year, euphoria is more evident.
It is unlikely that BFIA readers have watched others amass wealth in the stock market in recent years from the sidelines. In 2026, which should be another prosperous year for markets at a time when deposit rates are declining, bond prices are stagnating, and the gold bull market is over, we must hope that others take note.


Leave a comment on: "It's a good year for stocks, investors"